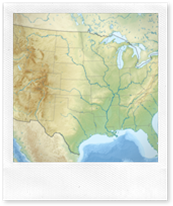
 A few weeks ago I came across a post on reddit asking how to draw a map given the distances between cities. I can never resist a good coding challenge, so next time I had a free afternoon I decided to give it a shot.
Like most problems, it turns out that plotting points on a map is quite easy if the data is perfect. However, if the data is imperfect then things get a whole lot trickier. Below is a description of the problem and how I solved it.
The Data
The data I used was a table of driving distances (in miles) between major US cities. The US highway system isn’t straight lines from point to point, so this introduces a certain amount of discrepancy into the numbers and ensures that we can’t just plot them out mathematically. For example, the distance between Miami and New Orleans listed below is 892 miles because the road goes around the cost, however, the straight line distance between the cities across the water is closer to 670 miles.
The Solution
Since we cannot just plot the points out mathematically the next easiest solution is to use a force directed graph approach. The basic approach is as follows:
- Lay the points out randomly in 2D space
- If two points are too far apart, move them a little closer together
If two points are too close together, move them slightly further apart - Repeat step two until the points stop moving or until you get bored of waiting
You can see a working copy of my solution below. Full source code is available here
Note that the “Total Error” is calculated by comparing the current distance between each pair of cities with the target distance. If this are going well then this number should get smaller with each iteration of the algorithm. The smallest total error possible with the highway data above appears to be about 3680 due to the discrepancies in the data mentioned above.
If you need help figuring out what the map should look like you can check here 
The Interesting Stuff
This solution is easy to code and gives pretty good results. However there are a few interesting things that result from this algorithm:
The orientation of the map is random and map is often flipped left to right
The source data is only distances with no direction, so the algorithm can’t tell which way around things should be.
The solution is very sensitive to local minima
Roughly 50% of the time Seattle of Miami will get stuck on the wrong side of the map and because the points repel each other they can’t pass through to be on the correct side. This is similar in concept to a blind man trying to get to the top of a mountain by always walking uphill. He will always find a high point, but he may not find the highest point. A possible solution to this problem would be to run the map simulation several times and then take the best answer found.
It’s hard to know when to stop the simulation
Force directed graphs are generally slow compared to other algorithms so we generally don’t want to run the simulation longer than we have to. However, knowing when things have stopped and wont get any better can be quite hard. Often, during the simulation things can seem to become static for a while with very little change between iterations before suddenly two points pop past each other and things begin rapidly improving again. Knowing when to stop the solution (without having a human watching it) is key to success.
I learnt a lot putting this little app together. All in all, it was an afternoon well wasted.
